A comprehensive guide to Microsoft’s Power BI course and building a career in data analytics
In today’s world, data analysis and visualization skills are essential for any professional seeking career advancement, which is why Microsoft’s Power BI Data Analysis course is so important.
It’s one of the most powerful training courses designed to equip data analysts and business professionals with the skills to use Power BI effectively and professionally.
What is Power BI?
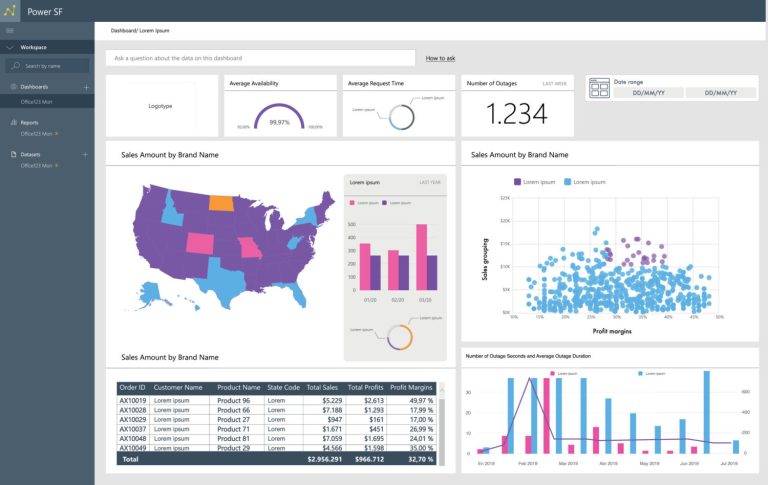
- Power BI is a data analytics and visualization tool developed by Microsoft.
- It’s used to transform raw data into interactive reports and dashboards that help individuals and businesses understand their data and make informed decisions.
- Power BI allows you to collect data from multiple sources, such as Excel, databases, CSV files, and cloud services.
- It then cleans and analyzes the data, creating interactive charts and reports that can be easily shared within teams.
- Its ease of use and powerful analytics make it one of the most sought-after business intelligence tools in the market.
Power BI Data Analysis Course
The Power BI Data Analysis course covers modern techniques and best practices that align with business and technical requirements for modeling, analyzing, and visualizing data using Power BI.
The course begins by explaining how to access and process data from various sources, whether relational, such as databases, or non-relational, such as Excel files and APIs.
It then moves on to transforming this data into interactive reports and dashboards that support decision-making.
Furthermore, it covers how to securely manage and share reports and dashboards within organizations, making it a comprehensive course that covers both the practical and professional aspects of using Power BI.
This course is specifically designed for
- Data analysts looking to enhance their skills using Power BI
- Data and information professionals who work with data daily
- Individuals who develop data visualization reports using cloud data technologies or on-premises systems
- It is also suitable for anyone seeking to understand data and transform it into clear insights that support strategic decisions.
Curriculum and Learning Methodology
The course is divided into several progressive learning paths, all at an intermediate level and geared towards a data analyst role using Power BI:
- Getting Started with Microsoft Analytics:
Number of Units: 4
In this path, you will learn the fundamentals of data analysis and the role of Power BI within the Microsoft Analytics framework, along with an understanding of the core concepts needed by any beginner or intermediate data analyst.
- Preparing Data for Analysis Using Power BI:
Number of Units: 3
This section focuses on how to clean and transform data and work with multiple data sources, a crucial step to ensure the accuracy of the analysis and the quality of the results.
- Modeling Data Using Power BI:
Number of Units: 7
One of the most important parts of the course, where you will learn how to:
- Build effective data models
- Establish relationships between tables
- Use DAX to create advanced metrics and calculations
- Designing Effective Reports in Power BI:
Number of Units: 4
This module focuses on data visualization and transforming numbers into engaging and easy-to-understand reports and dashboards, applying best practices in design and user experience.
- Managing and Securing Power BI:
Number of Units: 5
In this module, you will learn how to:
- Publish and share reports
- Manage access and permissions
- Secur data within Power BI
- This is crucial in professional work environments.
Why choose the Power BI course for data analysis?
- The Power BI Data Analysis course is offered by Microsoft, a globally trusted organization.
- It provides a comprehensive curriculum covering the entire data analysis journey from beginner to expert.
- What makes this course unique is its relevance to the job market and the demands of data analyst positions.
- It enhances your career prospects and opens doors to work in data analysis and business intelligence.
- The course also offers flexible learning options, allowing you to:
- Study through instructor-led training.
- Or learn at your own pace, according to your own schedule.
- This makes it suitable for both students and employees.
Tips for Getting the Most Out of the Course
- To get the best out of the Power BI Data Analysis course, we recommend following these tips:
- Don’t just watch the lessons; apply each step practically on Power BI Desktop. Learning by doing is the fastest way to mastery.
- Try using real-world data or data from your field of work, as this will help you understand the actual challenges faced by data analysts.
- Focus carefully on the fundamentals of data modeling, as building a sound data model is the foundation of any successful report. Give this part special attention.
- Learn the basics of DAX thoroughly. Even if it seems difficult at first, understanding DAX will give you significant power in data analysis and creating professional metrics.
- Then, pay attention to report design. Remember that a good report depends not only on the numbers but also on how clearly, attractively, and easily understandably they are presented.
- Keep in mind that Power BI is a constantly evolving tool, so be sure to keep up with updates and review the content from time to time.